Top Tableau Alternatives for Data Analysis and Visualization
Best Tableau Alternatives are in 2025 are:
Power BI (Microsoft)
QlikView
Looker (Google Cloud)
Sisense
Domo
Google Data Studio
Zoho Analytics
ThoughtSpot
If you're exploring alternatives to Tableau for data visualization and business intelligence, these tools provide diverse features that cater to various needs. From advanced analytics and data analytics capabilities to seamless integration with multiple data sources, these Tableau alternatives offer solutions tailored for businesses, analysts, and data-driven organizations. With an intuitive user interface and robust data visualization capabilities, these options deliver comprehensive platforms for analyzing and visualizing data, whether you prioritize affordability, ease of use, or specific functionalities.
Table of Contents
Why You Need Alternatives to Tableau
You need alternatives to Tableau if Tableau’s pricing, complexity, or specific feature gaps do not align with your requirements. While Tableau is an industry leader in data visualization solutions, its high cost and steep learning curve may deter smaller organizations or individuals, including data teams and business users. Alternatives to Tableau can offer more affordable visualization tools, better integration with SQL databases or your existing toolset, or enhanced features such as AI-driven analytics or native cloud compatibility. These tools can streamline your data analysis process and cater to the needs of data scientists and professionals in business analytics. Exploring these options helps you find a tool that meets your specific needs and budget constraints.
Who Should Consider Using Tableau Alternatives
You should consider using Tableau alternatives if your business or project requires features that Tableau lacks or if its pricing model exceeds your budget. Professionals who need highly customizable tools, better scalability, or integration with specific ecosystems may find better options with Tableau alternatives. Additionally, organizations with less technical expertise might opt for tools with simpler interfaces and shorter learning curves.
1. Businesses on a Budget
For businesses looking for affordable solutions, tools like Google Data Studio and Zoho Analytics provide cost-effective options with robust visualization and analytics features.
2. Enterprises Requiring Scalability
Large organizations needing scalable platforms for handling vast datasets can benefit from tools like Power BI or Looker, which integrate seamlessly with enterprise-level systems.
3. Professionals Seeking AI-Driven Insights
ThoughtSpot’s AI-powered analytics capabilities make it an excellent choice for professionals who want to leverage machine learning to uncover insights from their data.
Tableau Alternatives Comparison Table
| Feature | Power BI | QlikView | Looker | Sisense | Domo | Data Studio | ThoughtSpot |
|---|---|---|---|---|---|---|---|
| Ease of Use | Moderate | Moderate | Easy | Easy | Easy | Very Easy | Moderate |
| Pricing | Free & Paid Plans | Paid | Paid | Paid | Paid | Free | Paid |
| Platform Support | Windows | Windows, Web | Browser-based | Windows, Web | Windows, macOS | Browser-based | Browser-based |
| Collaboration Features | Extensive | Limited | Extensive | Extensive | Extensive | Moderate | Extensive |
| Analytics Capabilities | Advanced | Advanced | Advanced | Moderate | Moderate | Basic | AI-Driven |
Best Tableau Alternatives
Tableau is a widely popular data visualization and business intelligence tool, but it's not always the perfect fit for every organization. Whether you're seeking more cost-effective solutions, specialized features, or better integrations with existing tools, there are numerous alternatives to consider. Each of these alternatives brings its own unique strengths, making it easier to find the right fit for your data analytics and visualization needs. Below is a detailed look at some of the best Tableau alternatives for 2024.
1. Power BI (Microsoft)
Power BI is a leading business analytics tool by Microsoft. It allows users to visualize data, share insights across an organization, and embed them in apps or websites. Its integration with Microsoft Office and Azure makes it a popular choice for enterprises.
Power BI vs Tableau
Power BI and Tableau are often compared due to their similar capabilities in data visualization. Power BI offers stronger integration with Microsoft tools and is generally more cost-effective for small businesses. Tableau, on the other hand, is better suited for more complex data visualization needs with its advanced features.
Key Features of Power BI
Intuitive drag-and-drop interface
Seamless integration with Microsoft Office and Azure
Extensive data connectors for diverse datasets
Built-in artificial intelligence capabilities
Mobile-friendly dashboards
Power BI Pros
Affordable pricing plans
Strong Microsoft ecosystem integration
Frequent updates and new features
Suitable for businesses of all sizes
Power BI Cons
Can be resource-intensive for large datasets
Steeper learning curve for advanced features
Limited offline capabilities
Power BI Pricing
Power BI offers a free plan for individual users and paid plans starting at $9.99 per user per month for the Pro version. Premium plans for enterprises are available with additional features and higher data capacity.
2. QlikView
QlikView is a powerful business intelligence tool known for its associative data indexing engine. It enables users to explore data interactively and derive insights quickly. QlikView is widely used for developing guided analytics applications and dashboards.
QlikView vs Tableau
QlikView and Tableau both excel in data visualization, but their approaches differ. Tableau emphasizes ease of use and beautiful visuals, while QlikView focuses on in-depth data analysis and discovery. QlikView's associative engine allows users to explore data connections more interactively, making it ideal for advanced analytics.
Key Features of QlikView
Associative data indexing for advanced analysis
Guided analytics dashboards
In-memory data processing for faster performance
Extensive scripting and customization options
Strong data governance capabilities
QlikView Pros
Excellent for complex data analysis
Customizable and flexible dashboards
Real-time collaboration features
Strong focus on data governance and security
QlikView Cons
Steeper learning curve compared to Tableau
High licensing and implementation costs
Requires technical expertise for advanced usage
QlikView Pricing
QlikView offers a perpetual license model starting at approximately $1,500 per user, along with annual maintenance fees. Enterprise licensing options are also available for larger organizations.
3. Looker (Google Cloud)
Looker is a cloud-based business intelligence tool that focuses on modern data exploration and analytics. It is part of the Google Cloud ecosystem and provides users with a powerful platform for creating interactive dashboards and integrating data into workflows.
Looker vs Tableau
Looker and Tableau are both strong contenders in the BI market, but Looker stands out with its integration into Google Cloud and its data modeling capabilities through LookML. Tableau, on the other hand, is known for its superior visualization features and offline capabilities.
Key Features of Looker
LookML for data modeling and customization
Seamless integration with Google Cloud and BigQuery
Advanced collaboration and sharing options
Real-time data exploration and visualization
Built-in APIs for embedding analytics
Looker Pros
Excellent for data exploration and ad-hoc queries
Strong integration with Google Cloud ecosystem
Scalable for large datasets and enterprise needs
User-friendly interface for analysts and developers
Looker Cons
High licensing costs for small businesses
Requires technical expertise for LookML scripting
Limited offline functionality
Looker Pricing
Looker follows a custom pricing model based on the number of users and data queries. It is generally tailored for medium to large organizations, with pricing available upon request from Google Cloud.
4. Sisense
Sisense is a full-stack business intelligence tool designed for embedding analytics into applications and workflows. It is well-known for its ability to handle large datasets efficiently and its emphasis on simplifying complex data analysis.
Sisense vs Tableau
Sisense and Tableau cater to different user needs. Sisense excels in embedding analytics and handling massive datasets, while Tableau focuses on advanced visualization and storytelling. Sisense’s API-driven approach makes it ideal for developers integrating analytics into products.
Key Features of Sisense
In-chip data processing for high performance
Embeddable analytics with customizable APIs
Interactive dashboards with real-time updates
Advanced machine learning and predictive analytics
Robust data integration and ETL capabilities
Sisense Pros
Handles large datasets effectively
Flexible deployment options (on-premises and cloud)
Extensive customization through APIs
Excellent for embedding analytics into applications
Sisense Cons
Steeper learning curve for non-technical users
Higher cost for smaller organizations
Limited pre-built visualizations compared to Tableau
Sisense Pricing
Sisense uses a custom pricing model based on user needs, deployment options, and data volume. Interested users can request a quote directly from Sisense.
5. Domo
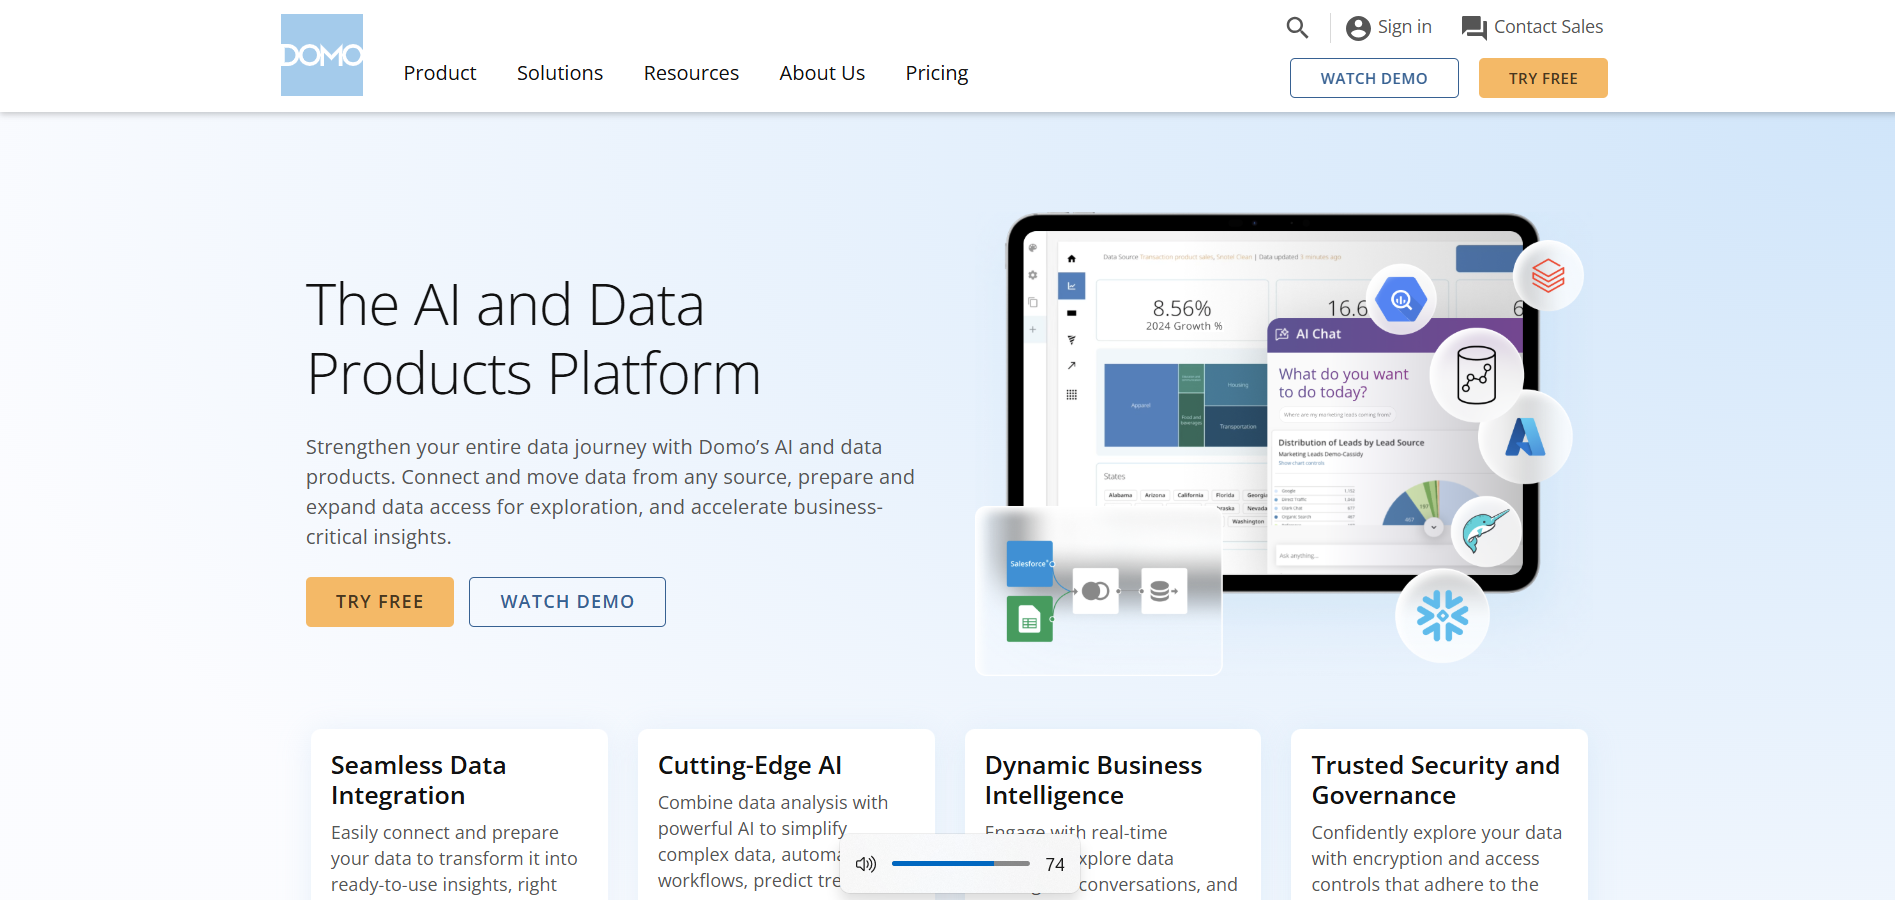
Domo is a cloud-based business intelligence platform that provides end-to-end data solutions, including data integration, visualization, and collaboration tools. It is popular for its easy-to-use interface and mobile-friendly dashboards.
Domo vs Tableau
Domo and Tableau share similarities in their focus on visualization, but Domo emphasizes a more comprehensive approach with built-in ETL tools and collaboration features. Tableau provides more advanced visualization capabilities, while Domo simplifies the process of managing and integrating data.
Key Features of Domo
Built-in ETL tools for data preparation
Pre-built connectors for hundreds of data sources
Mobile-first approach for dashboards
AI-powered insights and alerts
Collaboration tools for team-based analytics
Domo Pros
User-friendly and intuitive interface
Comprehensive platform for data integration and visualization
Mobile-friendly design for on-the-go access
AI-powered insights for proactive decision-making
Domo Cons
Expensive for smaller businesses
Limited customization compared to Tableau
May require additional investment in training
Domo Pricing
Domo offers custom pricing based on user requirements and the number of data sources. Interested organizations can contact Domo for a tailored quote.
6. Google Data Studio
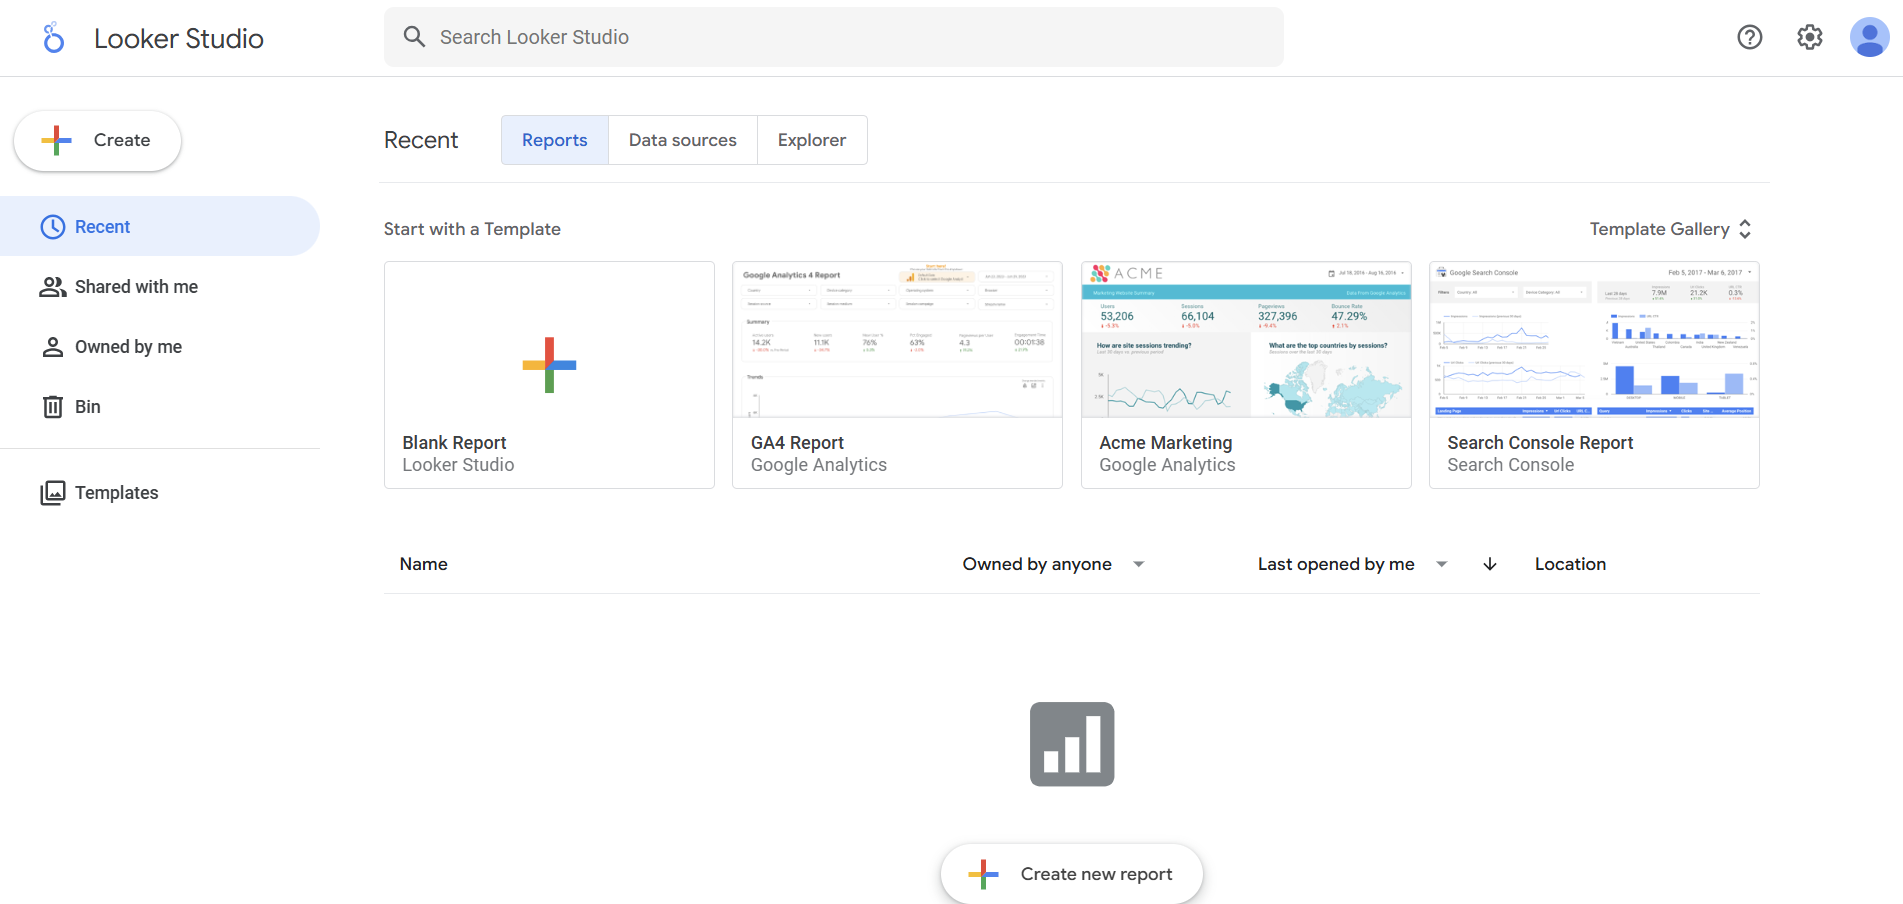
Google Data Studio is a free tool that allows users to create interactive dashboards and reports. It integrates seamlessly with other Google services like Google Analytics, BigQuery, and Google Ads, making it a great option for businesses in the Google ecosystem.
Google Data Studio vs Tableau
Google Data Studio is a lightweight alternative to Tableau, offering basic visualization and reporting features for free. Tableau provides more advanced capabilities, better scalability, and extensive data source compatibility, making it ideal for larger enterprises.
Key Features of Google Data Studio
Easy integration with Google services
Pre-built templates for dashboards and reports
Real-time data updates from connected sources
Collaboration tools for shared reporting
Customizable charts and widgets
Google Data Studio Pros
Free to use with no licensing costs
Seamless integration with the Google ecosystem
Intuitive interface for creating dashboards
Ideal for small businesses and marketers
Google Data Studio Cons
Limited features compared to Tableau
Not suitable for handling large datasets
Fewer customization options for complex visualizations
Google Data Studio Pricing
Google Data Studio is completely free to use, making it an attractive option for individuals and small businesses.
7. Zoho Analytics
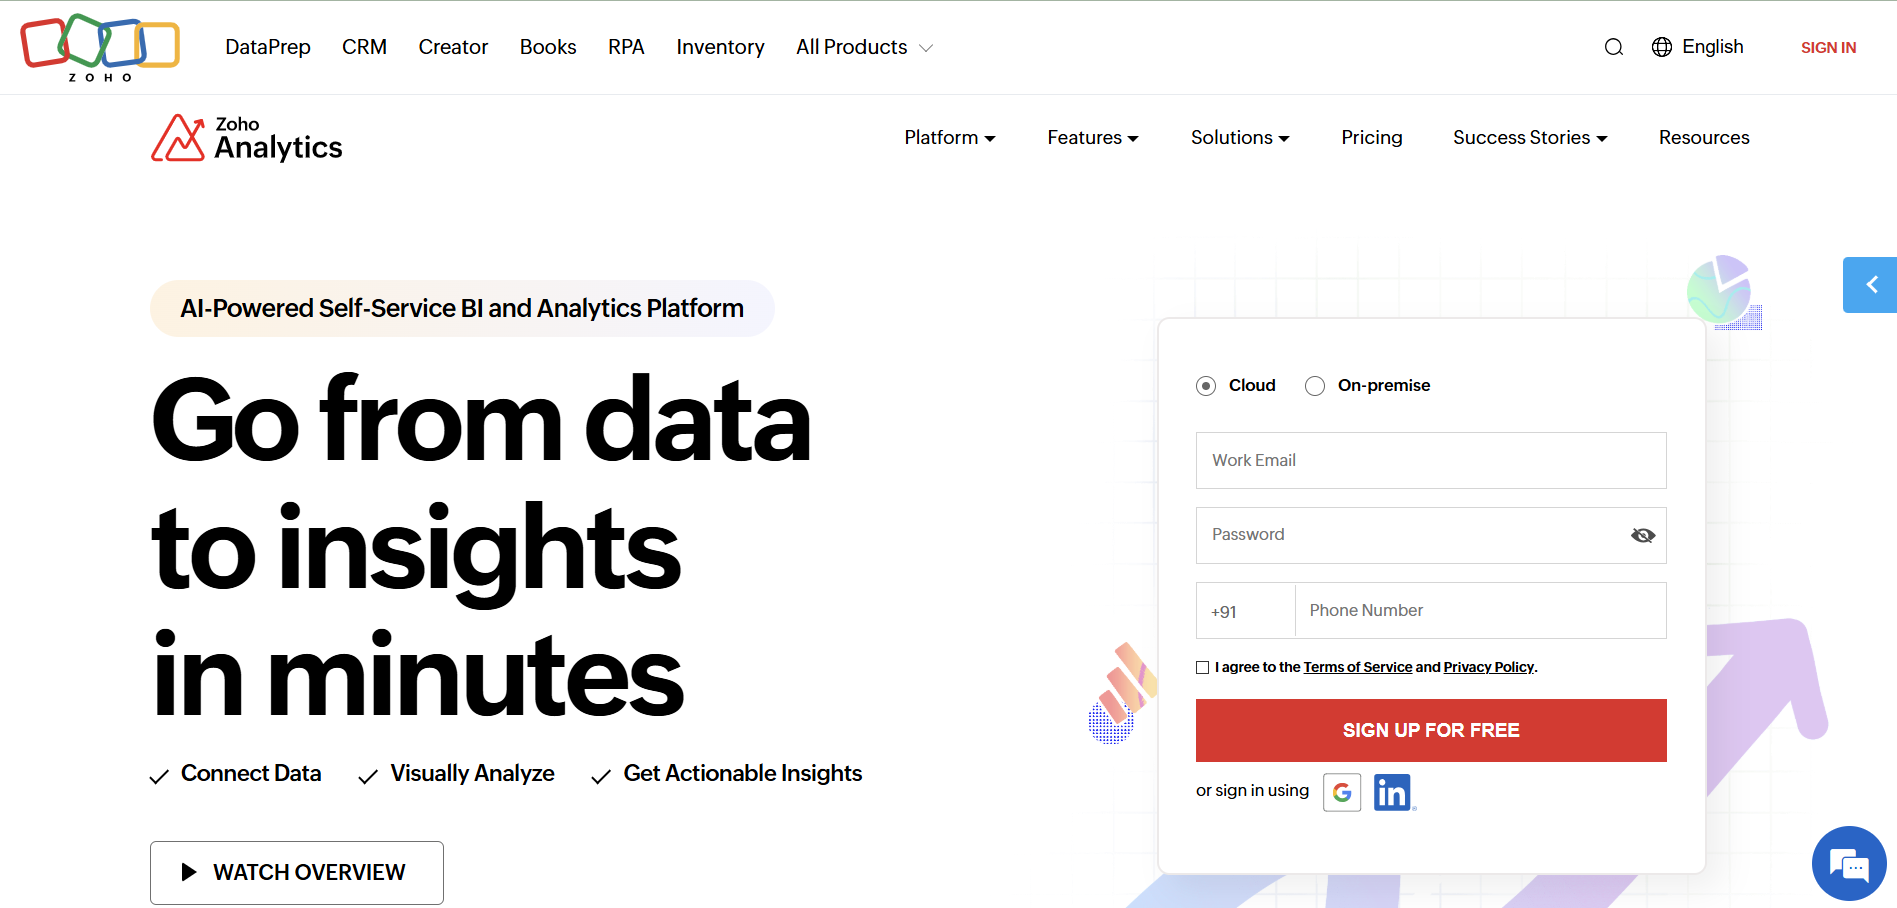
Zoho Analytics is a self-service business intelligence tool designed to help users create reports and dashboards quickly. It is part of the Zoho suite, which includes various tools for CRM, marketing, and project management.
Zoho Analytics vs Tableau
Zoho Analytics is an affordable alternative to Tableau, offering similar reporting and visualization features at a fraction of the cost. While Tableau is better suited for complex and large-scale analytics, Zoho Analytics works well for small to medium-sized businesses looking for simplicity.
Key Features of Zoho Analytics
Pre-built connectors for popular business apps
AI-driven insights through Zia (Zoho’s AI assistant)
Drag-and-drop interface for creating reports
Real-time data synchronization
White-labeling options for branding
Zoho Analytics Pros
Affordable pricing plans for small businesses
Strong integration with other Zoho apps
User-friendly interface with minimal learning curve
AI-driven insights for smarter decision-making
Zoho Analytics Cons
Limited scalability for enterprise use
Fewer advanced visualization features compared to Tableau
Less robust community support
Zoho Analytics Pricing
Zoho Analytics offers pricing plans starting at $24 per month for two users, with additional costs for more users and data sources.
8. ThoughtSpot
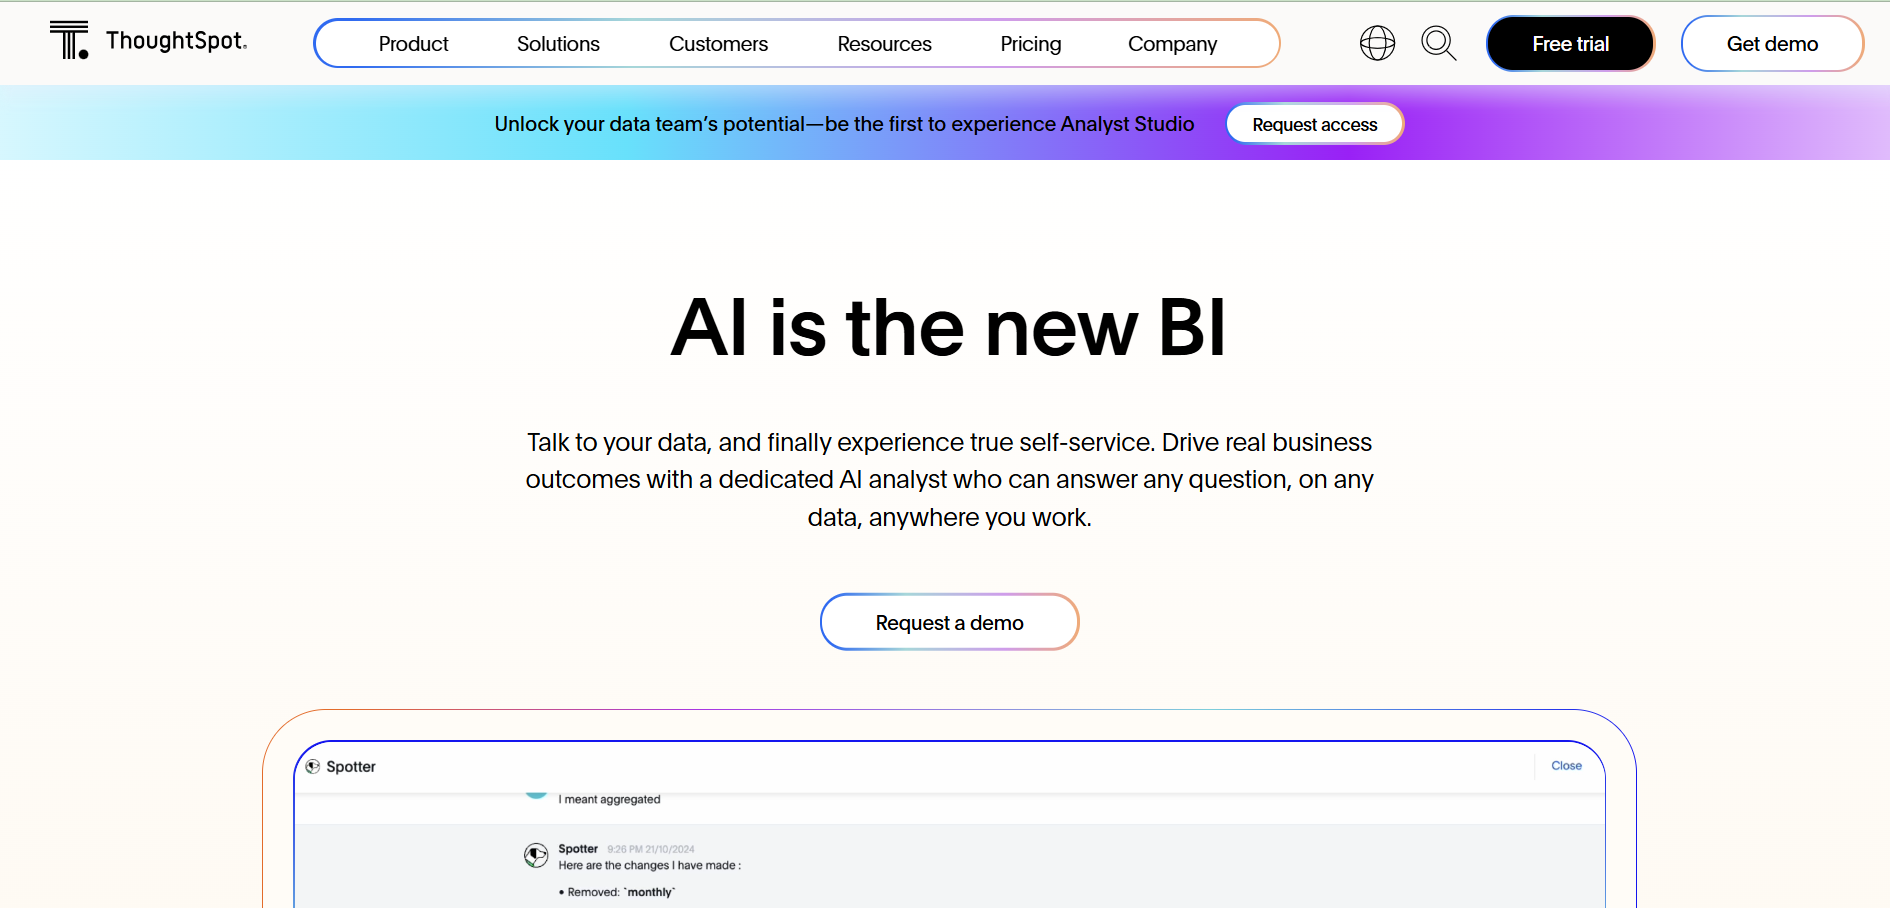
ThoughtSpot is an AI-powered analytics tool designed for non-technical users. It focuses on search-based analytics, allowing users to find insights quickly by typing questions in natural language.
ThoughtSpot vs Tableau
ThoughtSpot differs from Tableau by offering search-driven analytics powered by AI. While Tableau excels in creating detailed visualizations and dashboards, ThoughtSpot simplifies data exploration with its intuitive search interface and AI-driven insights.
Key Features of ThoughtSpot
AI-powered search for instant insights
Integration with cloud platforms like Snowflake and BigQuery
Advanced analytics with natural language queries
Real-time collaboration and sharing features
Scalable for large enterprises
ThoughtSpot Pros
Intuitive search-based interface
Excellent scalability for enterprise use
AI-driven insights for faster decision-making
Seamless integration with modern data warehouses
ThoughtSpot Cons
High licensing costs
Limited customization for advanced visualizations
Requires some training for effective use
ThoughtSpot Pricing
ThoughtSpot follows a custom pricing model based on user needs and deployment options. Interested users can contact ThoughtSpot for a personalized quote.
FAQs On Tableau Alternatives
1. What are the top alternatives to Tableau?
The top alternatives to Tableau include Power BI, QlikView, Looker, Sisense, Domo, Google Data Studio, Zoho Analytics, and ThoughtSpot. These tools offer diverse features for data visualization and business intelligence to meet different requirements.
2. Why should I consider using an alternative to Tableau?
You should consider using an alternative to Tableau if you need a tool with more affordable pricing, simpler interfaces, better integration with your ecosystem, or unique features like AI-driven insights or search-based analytics.
3. Are Tableau alternatives free to use?
Some Tableau alternatives, like Google Data Studio and certain tiers of Power BI, are free to use, while others like Sisense, Domo, and ThoughtSpot require paid subscriptions. Pricing varies based on the tool and the features offered.
4. Which Tableau alternative is best for small businesses?
For small businesses, tools like Power BI, Google Data Studio, and Zoho Analytics are excellent choices due to their affordability, ease of use, and integration with popular business tools.
5. Can I use Tableau alternatives for enterprise projects?
Yes, many Tableau alternatives, such as Power BI, Looker, Sisense, and ThoughtSpot, are designed for enterprise use, offering advanced features, scalability, and robust data integration capabilities.